OpenTelemetry Part 1 - Understanding the Pillars of Observability

In this three-part article series, I will delve deeper into the OpenTelemetry (OTEL for short) framework to gain a better understanding of telemetry and instrumentation in general, and for OTEL in particular. In the first part, I will explore the pillars of observability, the second part will focus on implementing the framework in a language-agnostic way, and finally, the third part will delve into understanding telemetry in various tools and applications.
The pillars of observability
The pillars are often known as logs, metrics, and traces. But what are the differences between them? And how are they used together to obtain a comprehensive view in an application or system? How is it tied to the OpenTelemetry framework?
Having access to logs, metrics, and traces alone may not inherently enhance the observability of systems, but a thorough understanding of these potent tools can empower the creation of more robust and efficient systems.
OpenTelemetry is vendor and tool agnostic, allowing seamless integration with a diverse array of Observability backends. These include well-known open-source tools such as Jaeger and Prometheus, alongside various commercial offerings like Azure Application Insights, AWS, DataDog, Elastic, Splunk, and many others as outlined in the OpenTelemetry ecosystem.
Frequently mentioned as the future of logging and instrumentation, OpenTelemetry provides a flexible and inclusive framework for observability across a broad spectrum of platforms and services.
Logs are immutable timestamped textual records of events, activities, or messages generated by systems. They provide detailed information about what happened within a system, including error messages, warnings, and informational events. Logs are essential for debugging, troubleshooting, and auditing, offering a valuable source of information to understand the historical context of system behavior. Logs are often generated by other frameworks but are also frequently generated by developers who need customized insights into the system they are building.
Metrics are measurements that provide insights into the performance and health of a system. They are numerical data points related to various aspects, such as resource utilization, response times, error rates, throughput, or customized measurements of domain objects. Metrics help in monitoring the overall system health, identifying trends, and establishing baselines for performance. Common examples include CPU usage percentages, request rates, and memory utilization. Custom measurements in a domain could, for example, be "order count/day."
Traces are a means of tracking the flow of a request as it traverses through different components and services in a distributed system. They consist of spans, which represent individual operations, and the relationships between these spans. Tracing is crucial for understanding the end-to-end journey of a request, diagnosing performance bottlenecks, and identifying dependencies within a complex architecture. Traces provide a visual representation of the path taken by a request across various services.

In OpenTelemetry, a Trace is built upon spans, which are the building blocks. Spans represent a unit of work or operation. Spans have attributes, including Parent Span ID and Span ID. These two are important because they are passed down between spans. A Child Span will then inherit the Parent Span ID, forming a chain of operations, building a Trace.
Sampling
Sampling involves the strategic selection of a subset of data for collection and analysis, rather than capturing and processing every individual piece of information. In tracing, this means deciding which traces and spans to retain, allowing developers and operators to gain meaningful insights without overwhelming the system with an excessive volume of data, effectively reducing costs. We won't need all telemetry indicating a successful operation, and we then replace the bulk with a smaller subset, yet statistically correct, of data.
Centralized Logging with OpenTelemetry Collector
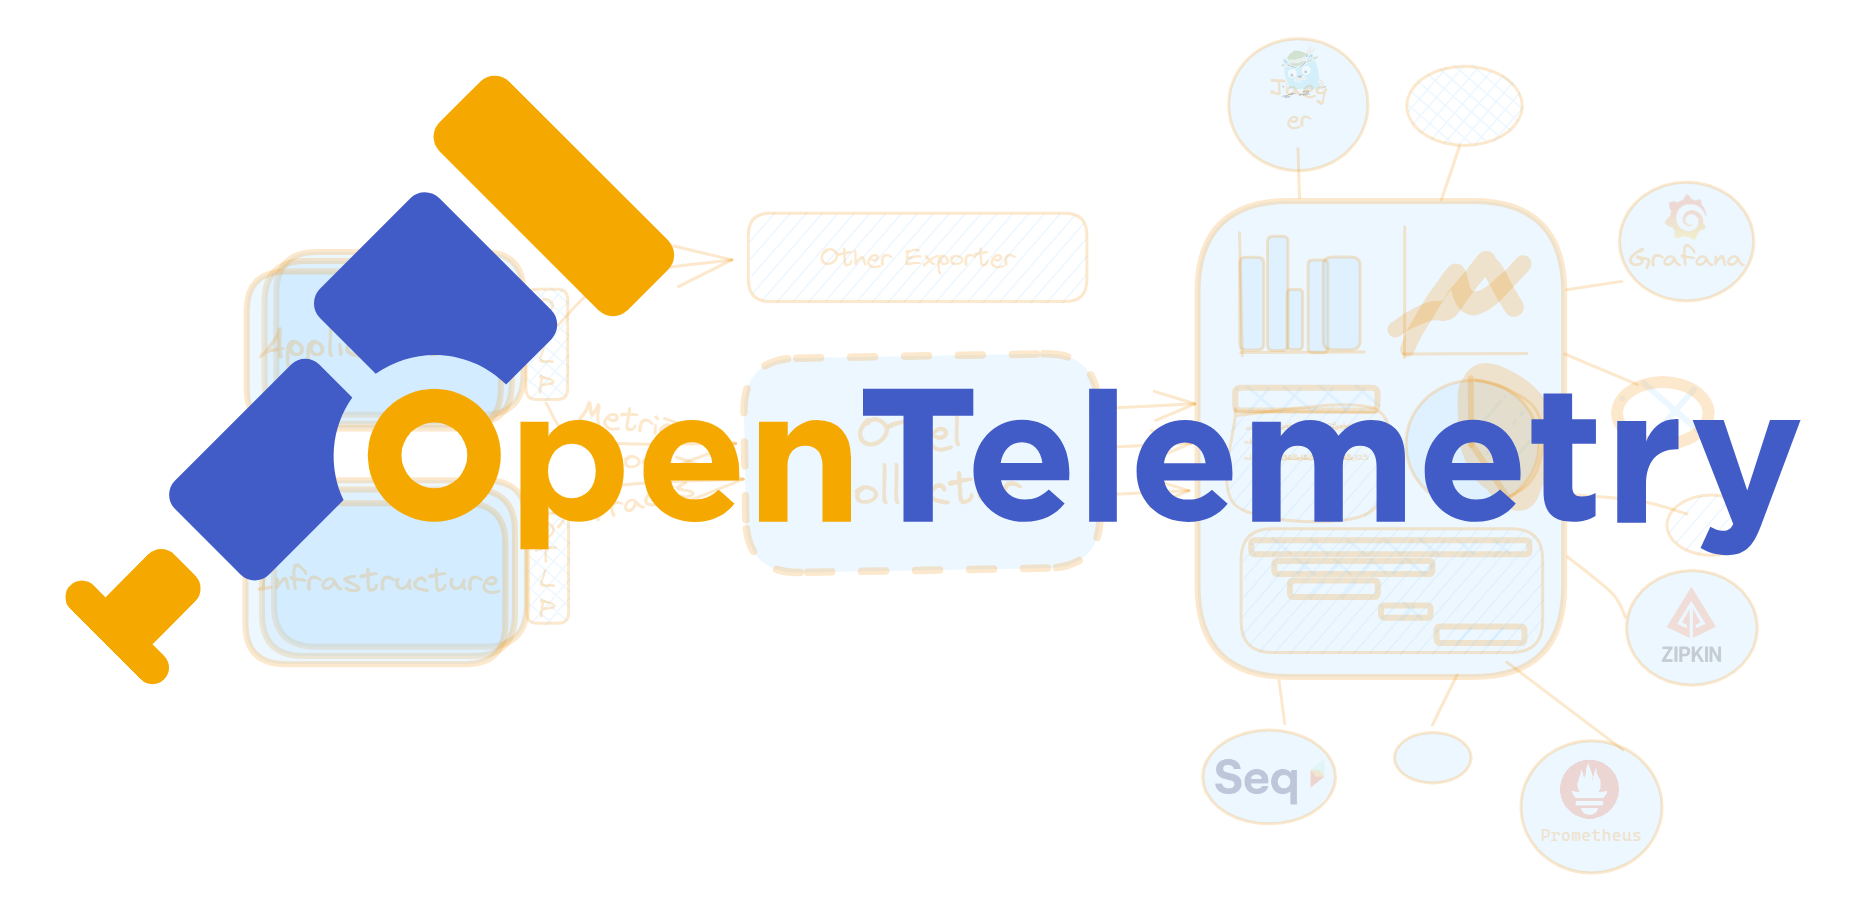
OpenTelemetry streamlines the transmission of instrumentation data directly to various backends, including Jaeger, Prometheus, Seq, and more, utilizing the OpenTelemetry Protocol. This not only optimizes the efficiency of instrumentation but also facilitates seamless integration with diverse observability tools.
However, the true power of OpenTelemetry lies in its vendor-agnostic, highly performant, stable, and configurable implementation known as the OTEL Collector. This component eliminates the necessity to deploy, manage, and upkeep multiple agents or collectors. With enhanced scalability, it supports various open-source observability data formats (e.g., Jaeger, Prometheus, Fluent Bit, etc.), allowing data transmission to one or more open-source or commercial backends.

This approach not only simplifies the telemetry data workflow but also ensures improved scalability and compatibility with a broad spectrum of observability tools. The OTEL Collector consolidates the reception, processing, and exporting of telemetry data, offering a robust solution for efficient and centralized management of instrumentation data in distributed systems.
In summary, the OpenTelemetry Collector plays a pivotal role in centralizing the ingestion and digestion of instrumentation data. Its support for various processors, including batching and filtering, coupled with centralized configuration management, makes it a powerful tool for achieving comprehensive and efficient centralized logging in distributed systems.
Wrapping up
As we conclude this first part of my article series on OpenTelemetry, we looked into the core of observability, uncovering the significance of logs, metrics, and traces. These elements not only explain the complexities of distributed systems but also lay the groundwork for the next articles in this series on the OpenTelemetry (OTEL) framework.
In the upcoming articles, we'll transition from theory to practical implementation, going into the gritty details of how OTEL becomes a language-agnostic solution across a range of systems.
Looking ahead, OpenTelemetry stands out as, in my humble opinion, a game-changer in logging and instrumentation. Positioned as a flexible and inclusive framework, it promises a unified solution for observability across lots of non-agnostic platforms and services.
Stay tuned for the next chapters in this series.