OpenTelemetry Part 3 - Observability

In this third part of the OpenTelemetry series, we dive into observability—the ability to monitor, track, and analyze Logs, Metrics, and Traces from distributed systems. We'll explore open-source tools and third-party libraries that help you visualize these three telemetry pillars in a consistent way. Our goal is to create a unified observability solution using mostly free and open-source software. While some premium tools offer extra features and support, we'll focus on building a cost-effective solution that can run on-premise.
Demo - Solution
In part 2 of this series, we created a microservices architecture using OpenTelemetry. It featured a simple web shop where users could place orders. We also implemented a dummy service that updated product prices periodically. If you followed along with the Docker setup in Part 2, you're ready to generate Logs, Metrics, and Traces for this observability demonstration.
Create a order
To create an order in our web shop, you need a JSON payload with the products you want to order. The products are seeded in the Postgres Product_Database during initialization.
Here is the sample data for our products:
| Product id | Name | Description | Price | Stock |
|---|---|---|---|---|
| P001 | Laptop | High-performance laptop with SSD | 1200.00 | 0 |
| P002 | Smartphone | Latest model with advanced features | 800.00 | 100 |
| P003 | Smart TV | 4K Ultra HD with Smart Hub | 1500.00 | 30 |
| P004 | Digital Camera | Professional DSLR camera | 900.00 | 20 |
| P005 | Wireless Headphones | Noise-canceling technology | 150.00 | 80 |
| P006 | Fitness Tracker | Track your health and activities | 80.00 | 120 |
| P007 | Gaming Console | Next-gen gaming experience | 400.00 | 0 |
| P008 | Coffee Maker | Espresso and cappuccino machine | 200.00 | 60 |
| P009 | External Hard Drive | 2TB storage capacity | 100.00 | 25 |
| P010 | Wireless Router | High-speed internet connectivity | 70.00 | 0 |
| P011 | Desk Chair | Ergonomic design for comfort | 120.00 | 35 |
| P012 | Portable Speaker | Bluetooth-enabled for on-the-go music | 50.00 | 70 |
| P013 | Cookware Set | Non-stick pots and pans | 150.00 | 15 |
| P014 | Backpack | Water-resistant and spacious | 40.00 | 90 |
| P015 | Printer | Color inkjet printer with wireless printing | 80.00 | 30 |
| P016 | Smart Thermostat | Energy-efficient temperature control | 100.00 | 40 |
| P017 | Yoga Mat | High-density foam for comfortable workouts | 20.00 | 65 |
| P018 | Blender | Powerful blender for smoothies and shakes | 60.00 | 25 |
| P019 | Security Camera | HD camera with motion detection | 120.00 | 0 |
| P020 | LED Desk Lamp | Adjustable brightness for study or work | 30.00 | 0 |
Here is the JSON payload to create an order:
{
    "Articles": [
        {
            "Id": "P001",
            "Price": "1200"
        },
        {
            "Id": "P002",
            "Price": "699"
        },
        {
            "Id": "P003",
            "Price": "1500"
        },
        {
            "Id": "P099",
            "Price": "1"
        }
    ]
}
This example has some intentional issues: P001 is out of stock, P002 has an incorrect price, and P099 doesn't exist in our product list. This simulates real-world scenarios where stock levels change and prices fluctuate.
To create an order, send this JSON payload as an HTTP POST request to http://localhost:8080/order.
You'll get a response like this:
{
    "order": {
        "notification": {
            "notificationsSent": true
        },
        "order": {
            "id": "OR1712081210523"
        },
        "payment": {
            "paymentSucceeded": true
        },
        "product": {
            "orderedProducts": [
                {
                    "id": "P002",
                    "price": 800.0
                },
                {
                    "id": "P003",
                    "price": 1500.0
                }
            ],
            "missingInventory": [
                {
                    "id": "P001",
                    "price": 1200.0
                },
                {
                    "id": "P099",
                    "price": 1
                }
            ]
        },
        "shipping": {
            "trackingNumber": "TR303589374SE",
            "estimatedDelivery": "2024-04-05T18:06:50.8414918Z"
        }
    }
}
The response shows that P002's price was corrected, while P001 and P099 were not included in the order due to stock issues. You also see the order ID, payment status, and estimated delivery information.
From this response, we can tell that several services were involved, but it's unclear what happened behind the scenes. This is where observability tools come in, helping us trace the request's journey, measure performance, and monitor system health.
Open Source
Let's look at open-source tools that can help us achieve observability in our development environment.
Jaeger
Jaeger is an open-source distributed tracing system that helps you monitor microservices. It tracks the flow of requests, identifies performance bottlenecks, and helps you understand service dependencies. Although Jaeger has production-level features, it’s commonly used in development and testing environments.
Features
Distributed Tracing: Jaeger allows you to trace requests across different microservices, providing a detailed view of their execution flow.
Span and Trace Visualizations: It offers graphical representations of traces and spans, enabling easier identification of performance bottlenecks.
Integration with OpenTelemetry: Jaeger is one of the primary backends supported by OpenTelemetry, making it simple to integrate into existing applications.
Sampling: Jaeger supports various sampling strategies to manage the volume of collected traces.
Use Cases
Root Cause Analysis: Find out where errors occur and understand their propagation across services.
Performance Optimization: Identify slow-performing services and optimize them.
Service Dependencies: Understand how services interact with each other.
Setup and Configuration
To use Jaeger, you'll need to set up a Jaeger backend and a storage system, like Elasticsearch or Cassandra. You can run Jaeger in Docker using the "all-in-one" configuration, which includes all necessary components but doesn't persist data after you stop the container.
For our example, let's look at how Jaeger traces our order creation request. This trace provides a visual representation of the request's journey across multiple services.
Traces
With Jaeger, you can visualize how a request moves through your system. Here's an example from our order creation scenario:
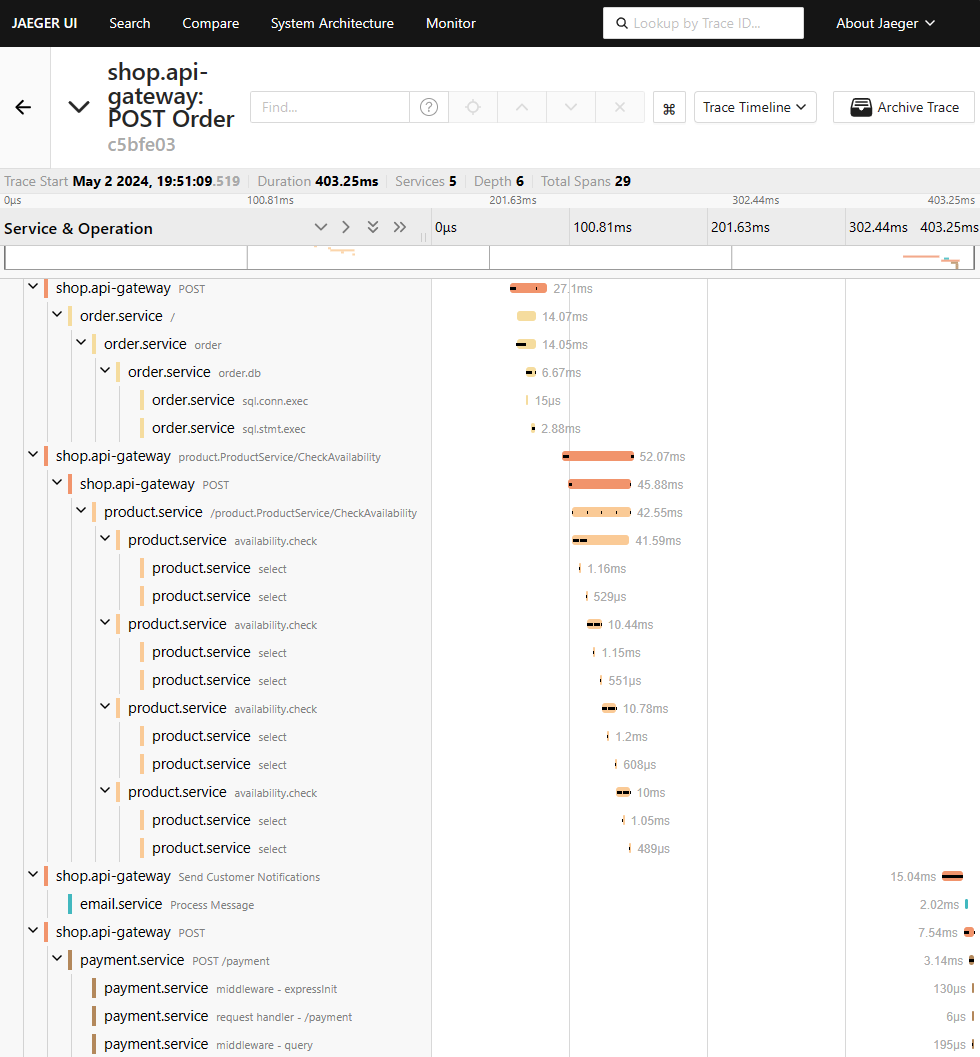
This timeline graph shows all the services involved in the order process. It provides a detailed view of each step along the way. If you expand a specific span, you get even more information about what happened at that point in the process.
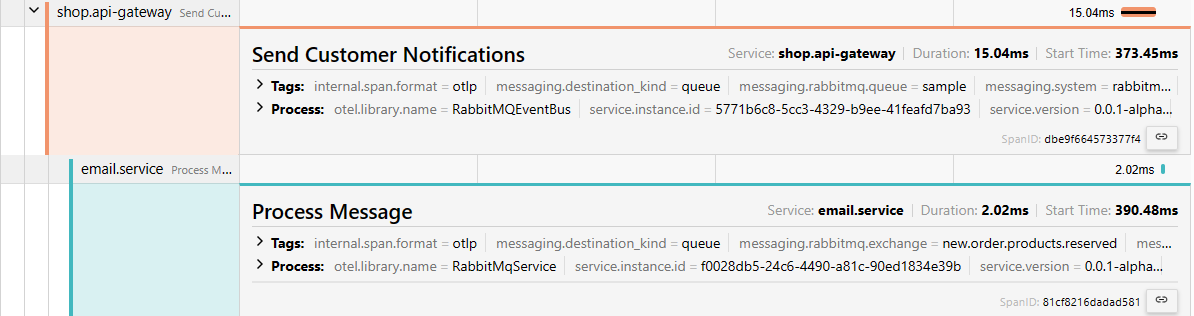
For example, you might see a producer and subscriber responsible for sending an email notification to the customer. You'll also find other details like tags, attributes, and the service version. The great thing about Open Telemetry is that you can customize it to fit your needs, allowing you to focus on the most important parts of your application's flow.
Prometheus
Prometheus is an open-source monitoring and alerting toolkit primarily used for capturing time-series data, such as metrics, from various systems and applications. It is widely adopted for its robust querying language, PromQL, and its seamless integration with OpenTelemetry.
Features
Time-Series Data Collection: Prometheus collects metrics at regular intervals, allowing for time-series analysis.
PromQL Query Language: A powerful query language for querying metrics data and creating complex expressions.
Alerting: Supports alerting rules to trigger notifications when specific conditions are met.
Service Discovery: Automatically discover targets for metric collection in a dynamic environment.
Integration with Grafana: Prometheus works well with Grafana for visualization.
Use Cases
Infrastructure Monitoring: Track resource usage and performance across various components.
Application Metrics: Monitor application-specific metrics such as response times, error rates, and throughput.
Alerting: Set up alerts to notify you when metrics exceed defined thresholds.
Setup and Configuration
Prometheus can be set up as a standalone server, collecting metrics from various exporters or OpenTelemetry instrumentation. Once installed, you can configure scrape jobs to define which services to monitor. Visualization and analysis can be done using Grafana or the built-in Prometheus dashboard.
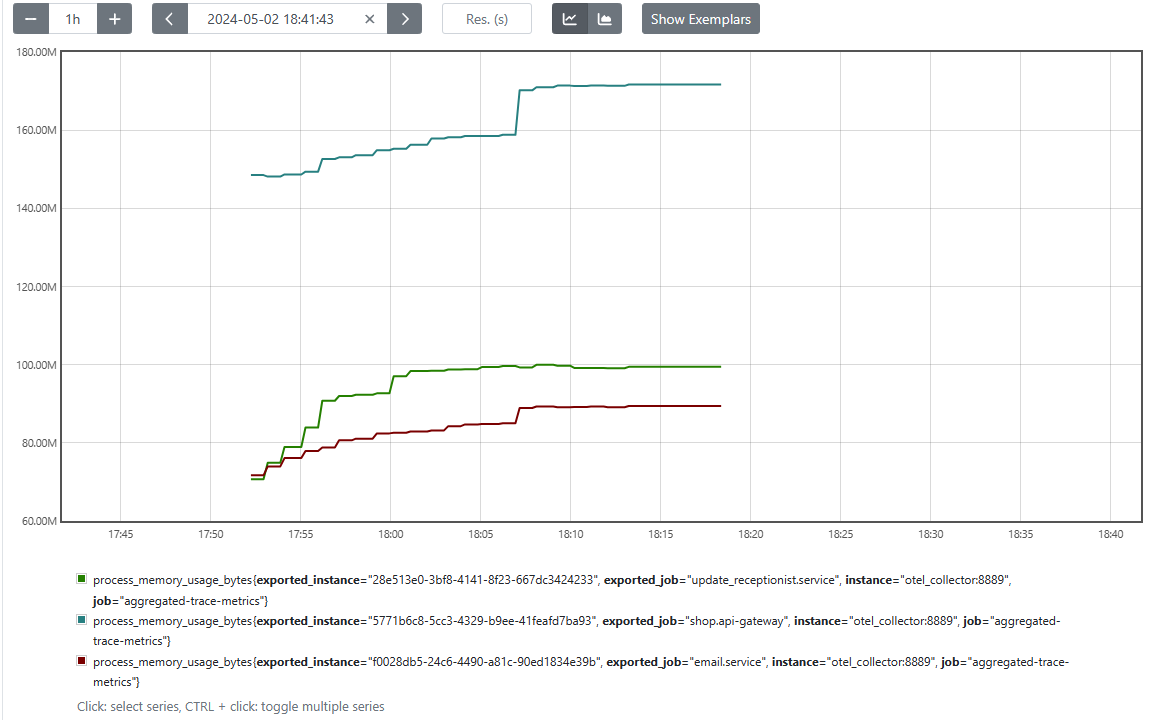
Metrics
Prometheus allows you to monitor a variety of metrics generated by your services, infrastructure, and OpenTelemetry collector. For example, you can check how much memory different services are using in near real-time. You can also set up alerts to notify you when certain metrics hit specific thresholds, giving you a heads-up before small issues become big problems.
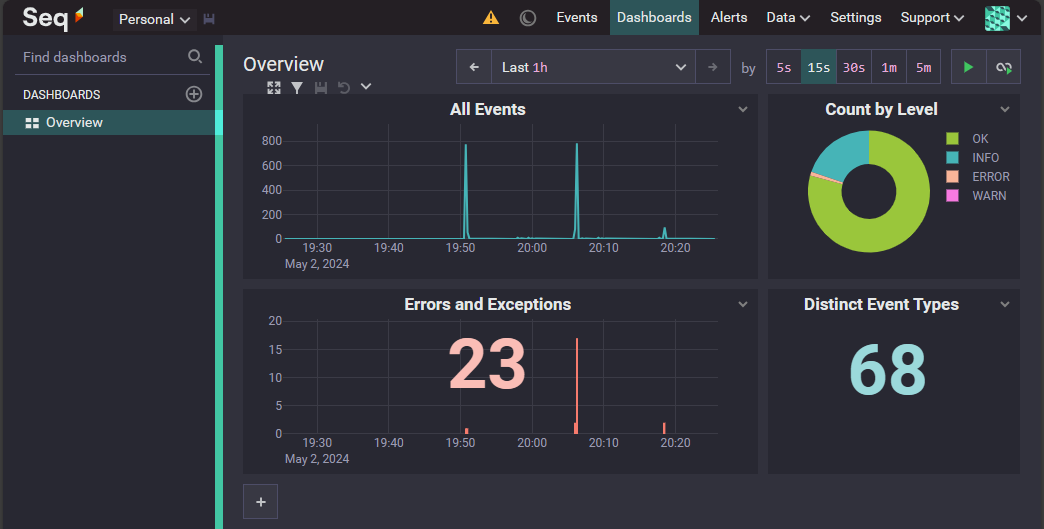
Seq
Seq is a log aggregation and visualization platform designed for structured logs. It offers powerful search capabilities and is commonly used for analyzing logs from .NET and other structured logging systems. While not strictly open-source, Seq has a community edition that can be used in smaller-scale environments without a subscription fee.
Features
Structured Log Aggregation: Seq collects and stores structured logs for analysis.
Advanced Search and Filtering: Allows you to search logs based on specific fields and conditions.
Correlation: Supports correlation of logs across different sources to understand request flow.
Alerting and Notifications: Set up alerts based on log patterns or specific events.
Integrations: Works with popular logging frameworks like Serilog, NLog, and OpenTelemetry.
Use Cases
Log Analysis: Search and analyze application logs to understand behavior and detect anomalies.
Troubleshooting: Investigate specific log entries and correlate them with system events.
Alerting and Notifications: Create alerts based on specific log patterns or events.
Setup and Configuration
Seq can be set up on-premise or in the cloud. After installation, configure your application to send structured logs to Seq using appropriate libraries or OpenTelemetry instrumentation. Use the Seq web interface to visualize and search through logs.
Logs
Seq allows you to view logs from all your systems in one place. This is powerful because you can follow a log trace from start to finish without having to check multiple databases or files. It helps you quickly find where things went wrong without the usual hassle of cross-referencing different sources.
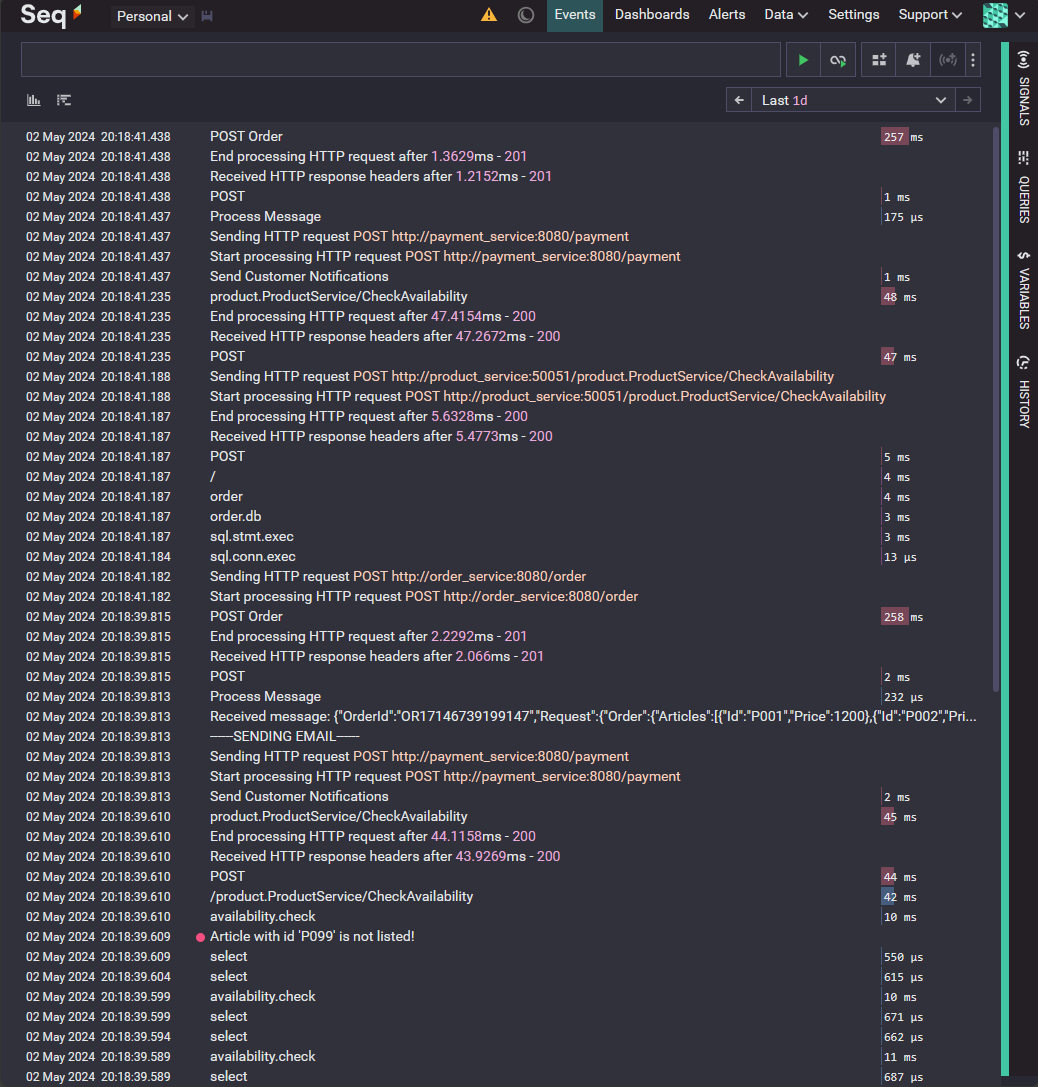
With Seq, you also get a better overview of potential security issues like intrusions or other types of system attacks.
Dashboards and alerts in Seq make it easy to spot problems at a glance, giving you an early warning when something's not right.
Zipkin
Zipkin is an open-source distributed tracing system designed to trace requests across microservices. It provides similar functionality to Jaeger, with a focus on ease of use and integration with existing applications. Zipkin has been around for ages and i first played with it when service mesh:es like Istio was the buzz.
Zipkin's features are similar to Jaeger's, so it's a matter of preference when choosing between the two. However, Zipkin is known for its simplicity, making it ideal for quick setup and basic distributed tracing.
Premium Tools
While open-source tools can handle most observability needs, some premium tools offer additional features and support. These tools often require a subscription or one-time purchase. Here are some well-known premium tools for observability:
Honeycomb.io: A cloud-based observability platform designed for distributed tracing and high-cardinality data analysis.
Azure Monitor: Part of Microsoft Azure's cloud services, offering observability tools for metrics, logs, and traces.
AWS OpenTelemetry: Amazon's observability solution with OpenTelemetry integration.
Splunk: A comprehensive platform for searching, monitoring, and analyzing machine-generated data.
SigNoz: An open-source observability platform that supports metrics, traces, and logs.
I've experimented with SigNoz to showcase an alternative toolset. SigNoz has a Docker-based setup that allows you to integrate your services with minimal configuration. You can find an example setup on their GitHub repository.
I won't include images here because the output looks similar to what we've already discussed, but with a different user interface.
Look at my sample here, where i integrated my own services and got it to run on windows
Wrapping up
Observability is crucial for understanding, troubleshooting, and improving microservices-based architectures. With OpenTelemetry and tools like Jaeger, Prometheus, Seq, and Zipkin, you have a range of open-source solutions to choose from. If you're interested in premium services, options like Honeycomb, Azure Monitor, and Splunk offer extra features and support, though they usually require a subscription.
When setting up your observability stack, make sure you implement OpenTelemetry across all the systems you want to monitor. If one part of your architecture lacks OpenTelemetry, it creates a gap in your monitoring, breaking the chain of spans and traces. This can leave you with incomplete data and make troubleshooting more difficult.
To avoid these gaps, start with a simple setup and ensure all core services are instrumented. Once you have a stable baseline, you can expand to more complex configurations like child spans and custom metrics. This way, you'll get the most out of your OpenTelemetry implementation and maintain a consistent view of your system's health.
Hopefully this series has been giving for you. Please reach out on my LinkedIn or johanol.com/contact.
As always, all code is up on GitHub